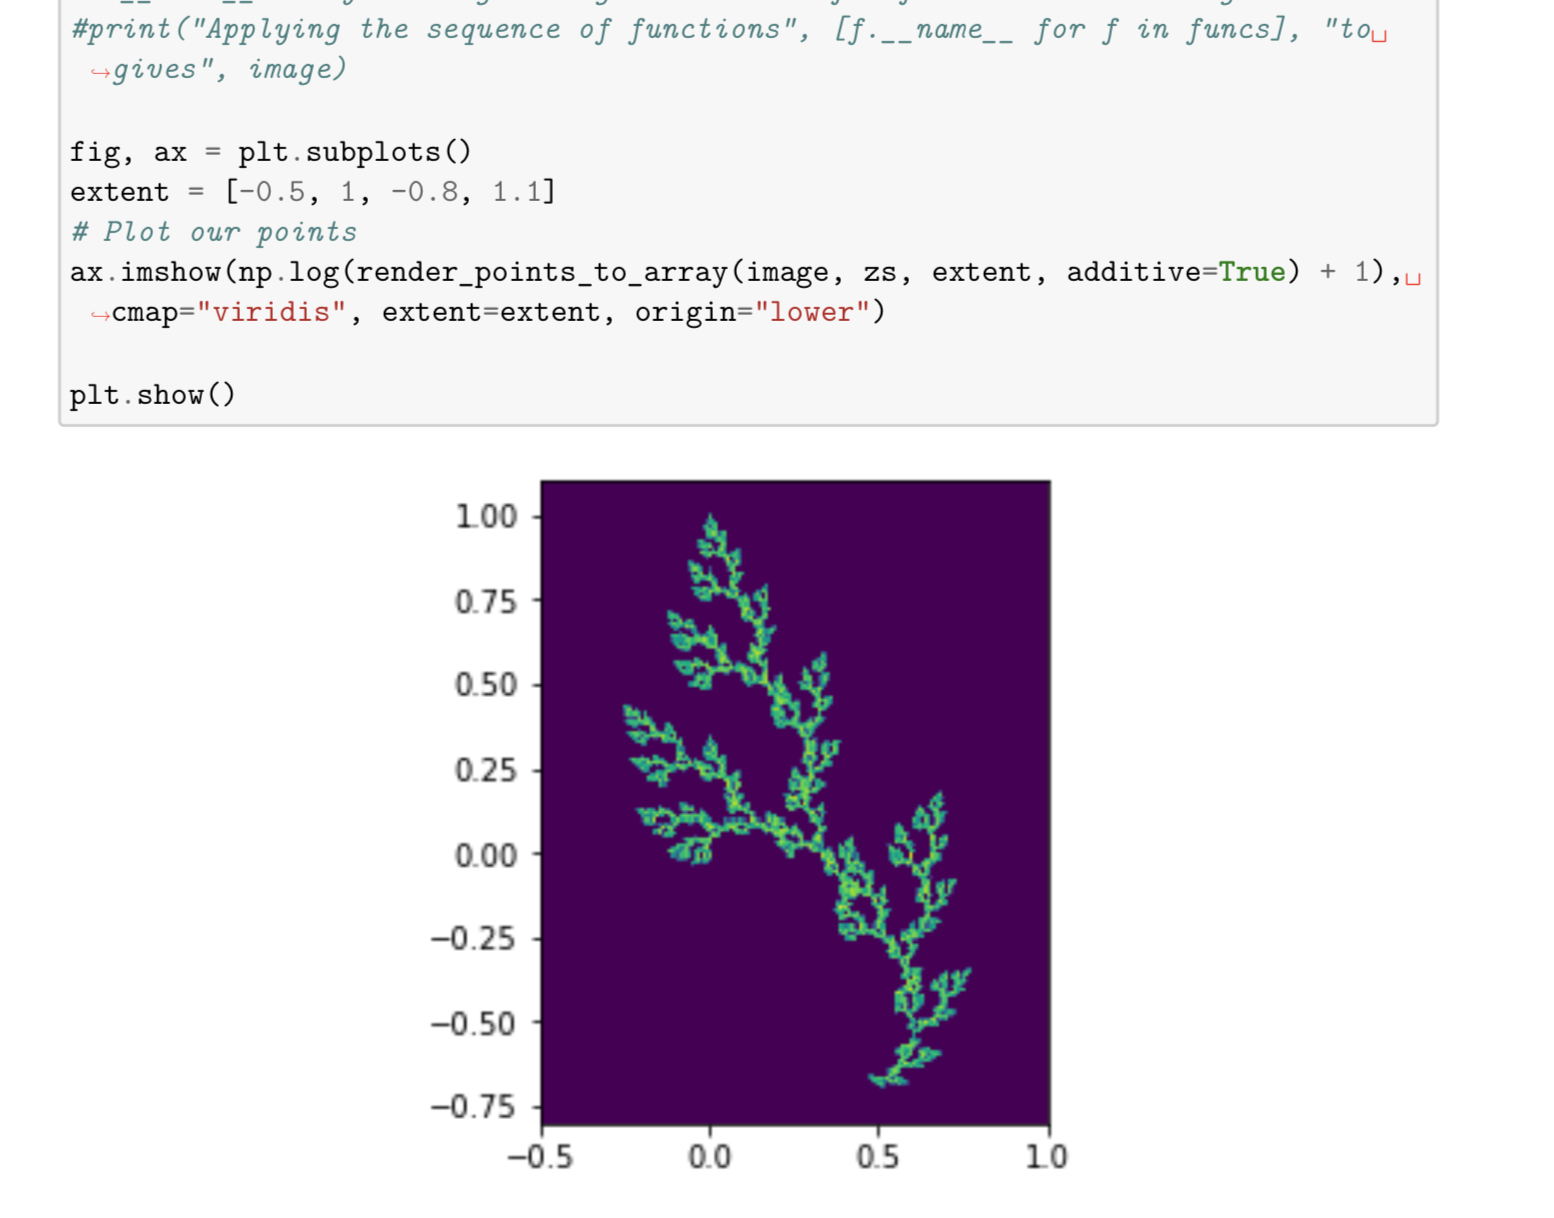
Fractal Graphics

Explore the shapes and patterns of the Cantor set, Koch snowflake, and many other fractals generated by the basins of attraction of complex functions. I also show you how estimate the box-counting dimensions of these fractals by using linear regression, and then compare it to their similarity dimensions.
Markov Chains
Check out some of the cool applications of Markov chains! We parse through some of Shakespeare’s work to create a chain of probabilities for words coming after one another. I use this chain to generate new Shakespearean writing. Finally, I display the Barnsley Fern and other fractals by using more complex Markov chains.
Vector Field Dynamics
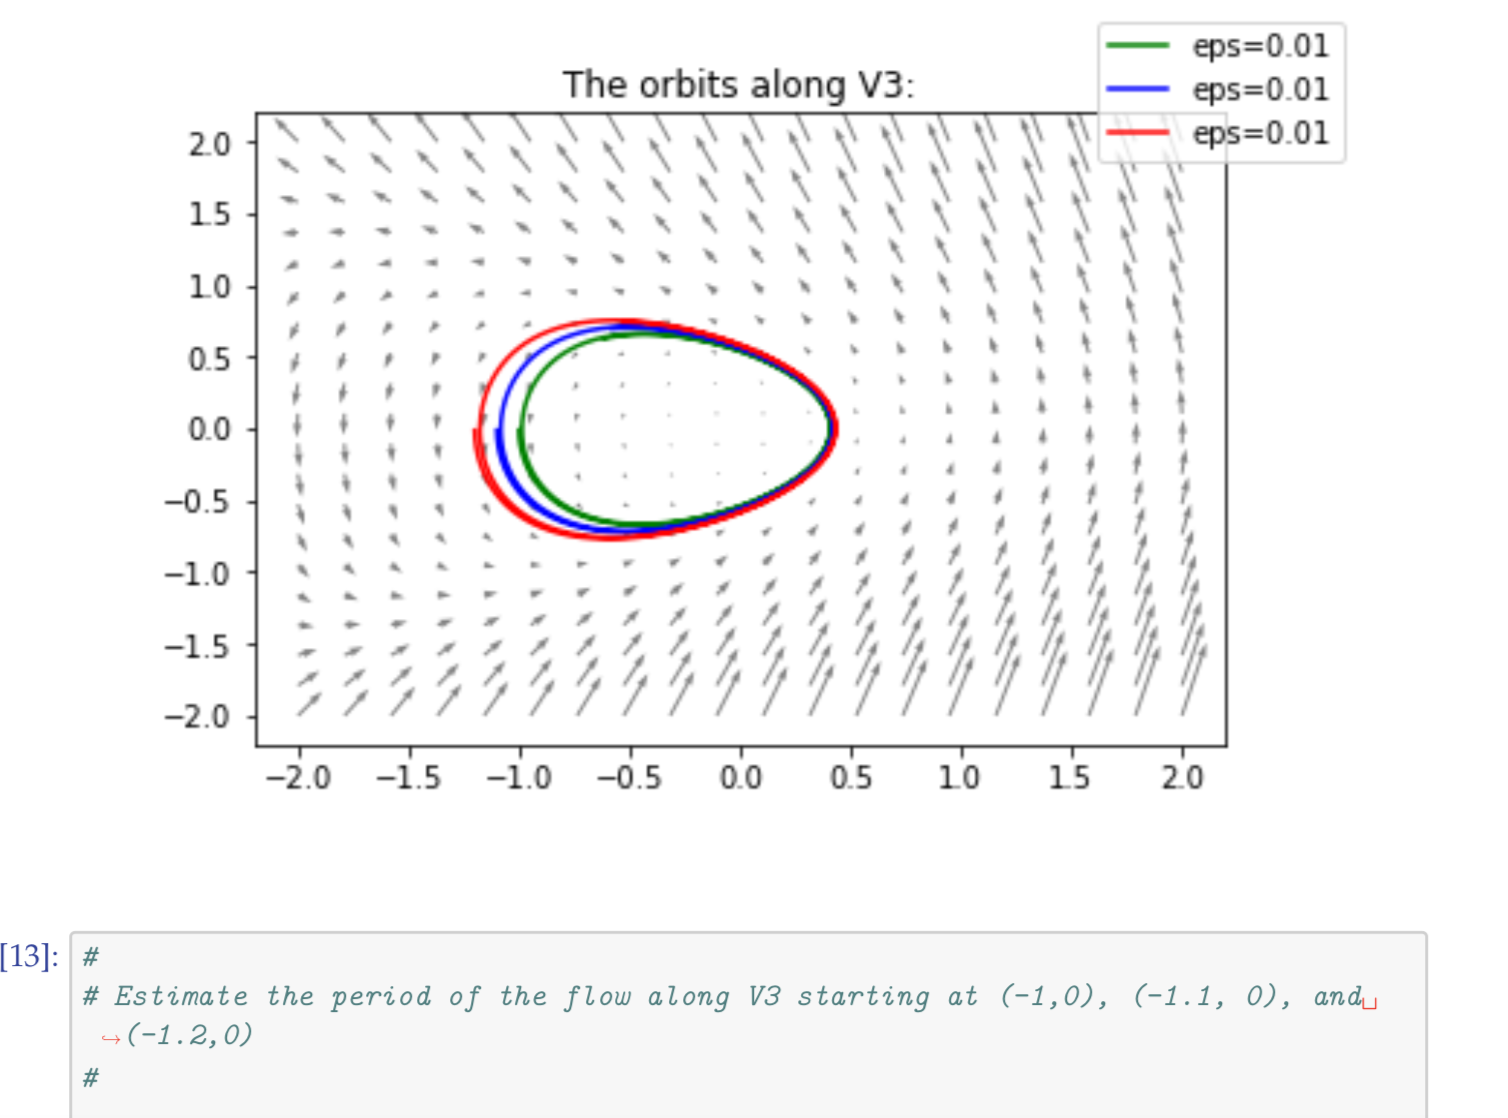
In this program, I explore different vector fields and periodic orbits of dynamical systems. By modifying the tolerance of error in our approximations, we can estimate the length of these periods. Then, I simulate multiple polygons orbiting through the vector fields. At the end, I show how a tiny particle form a ring around a planet (ie. Saturn).
The Logistic Map
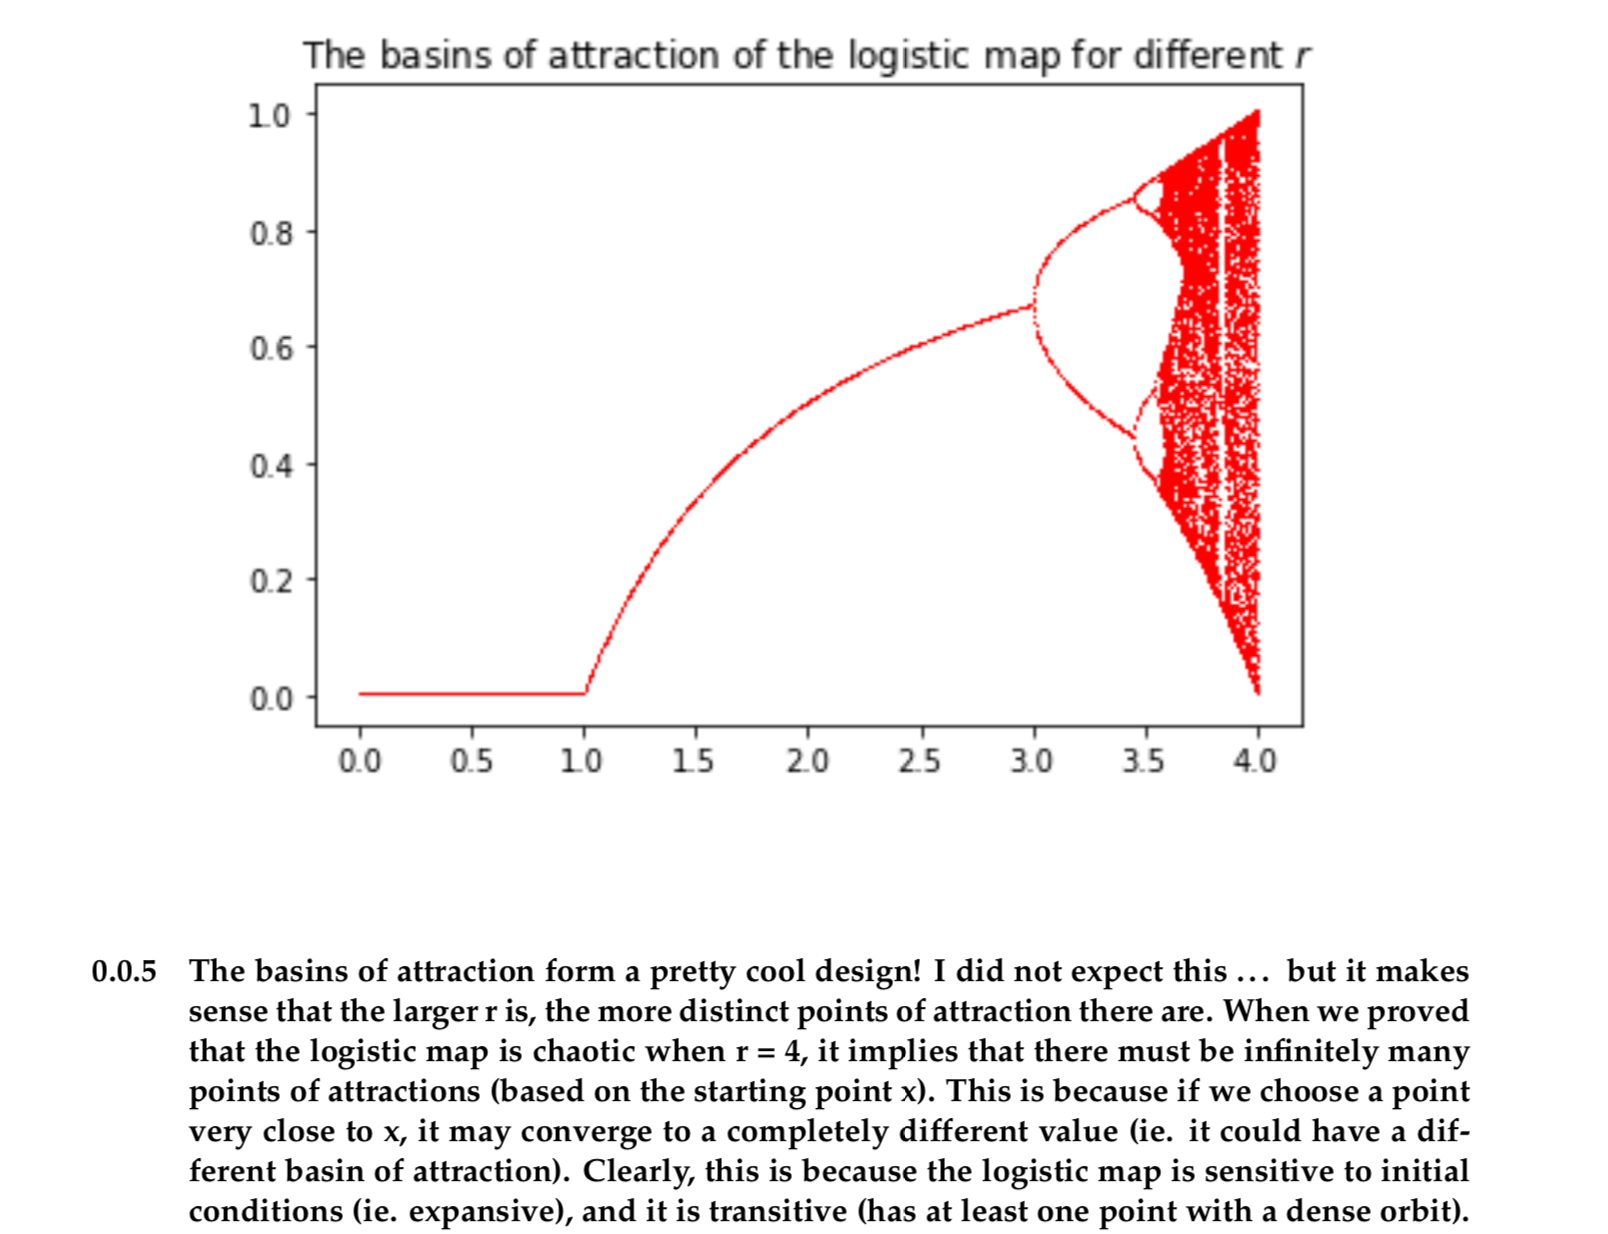
Here, I display the logistic growth of a population subject to various initial conditions. The main goal of this program is to demonstrate the chaotic behavior of the logistic map by plotting the basins of attractions for various values of r. The image above is the bifurcation diagram for the logistic map. We determine when the map is chaotic (expansive, dense orbit).